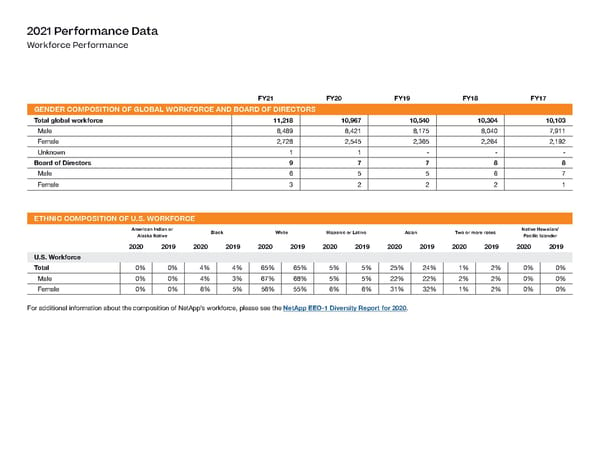
2021 Performance Data Workforce Performance FY21 FY20 FY19 FY18 FY17 GENDER COMPOSITION OF GLOBAL WORKFORCE AND BOARD OF DIRECTORS Total global workforce 11,218 10,967 10,540 10,304 10,103 Male 8,489 8,421 8,175 8,040 7,911 Female 2,728 2,545 2,365 2,264 2,192 Unknown 1 1 - - - Board of Directors 9 7 7 8 8 Male 6 5 5 6 7 Female 3 2 2 2 1 ETHNIC COMPOSITION OF U.S. WORKFORCE American Indian or Black White Hispanic or Latino Asian Two or more races Native Hawaiian/ Alaska Native Pacific Islander 2020 2019 2020 2019 2020 2019 2020 2019 2020 2019 2020 2019 2020 2019 U.S. Workforce Total 0% 0% 4% 4% 65% 65% 5% 5% 25% 24% 1% 2% 0% 0% Male 0% 0% 4% 3% 67% 68% 5% 5% 22% 22% 2% 2% 0% 0% Female 0% 0% 6% 5% 56% 55% 6% 6% 31% 32% 1% 2% 0% 0% For additional information about the composition of NetApp’s workforce, please see the NetApp EEO-1 Diversity Report for 2020.
 ESG Report | NetApp Page 55 Page 57